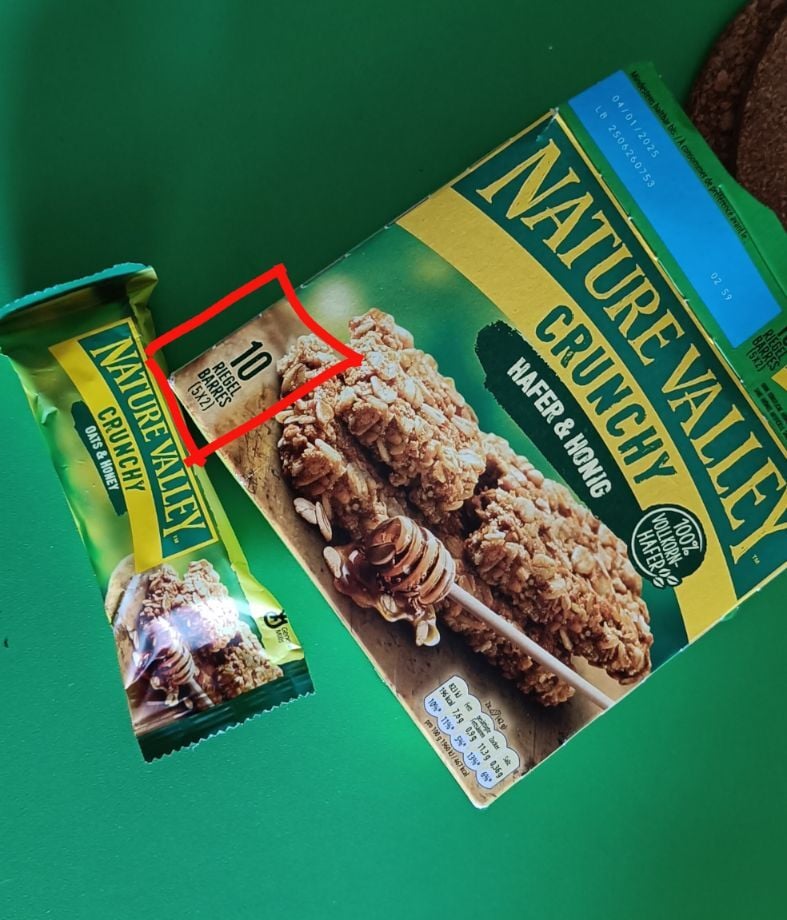
That's crazy helpful - thanks!
ABasilPlant
Perfect, thanks a million! I'll be getting on them soon!
Could you link the page which shows your exact config at that price? I can't find anything like that. KVM, AMD, Windows VPS - I looked at all three but none suggest the price you've written.
That price sounds like a steal, and I'd love to get it if possible. I currently pay $6/month per VPS with Digital Ocean
This website shows the SearXNG public instances. It is updated every 24 hours, except the response times which are updated every 3 hours. It requires Javascript until the issue #9 is fixed.
Isn't Angstrom 10^-10 meters? And nanometers 10^-9 meters? So 20A (assuming A = Angstrom) is just 2nm?
Are they trying to say that by moving to this new era, they'll go single digit Angstrom i.e., 0.x nm?
The debug version you compile doesn't affect the code; it just stores more information about symbols. The whole shtick about the debugger replacing instructions with INT3 still happens.
You can validate that the code isn't affected yourself by running objdump on two binaries, one compiled with debug symbols and one without. Otherwise if you're lazy (like me 😄):
https://stackoverflow.com/a/8676610
And for completeness: https://gcc.gnu.org/onlinedocs/gcc-14.1.0/gcc/Debugging-Options.html
Excellent question!
Before replacing the instruction with INT 3, the debugger keeps a note of what instruction was at that point in the code. When the CPU encounters INT 3, it hands control to the debugger.
When the debugging operations are done, the debugger replaces the INT 3 with the original instruction and makes the instruction pointer go back one step, thereby ensuring that the original instruction is executed.
https://en.wikipedia.org/wiki/INT_(x86_instruction) (scroll down to INT3)
https://stackoverflow.com/a/61946177
The TL;DR is that it's used by debuggers to set a breakpoint in code.
For example, if you're familiar with gdb, one of the simplest ways to make code stop executing at a particular point in the code is to add a breakpoint there.
Gdb replaces the instruction at the breakpoint with 0xCC, which happens to be the opcode for INT 3
generate interrupt 3. When the CPU encounters the instruction, it generates interrupt 3, following which the kernel's interrupt handler sends a signal (SIGTRAP) to the debugger. Thus, the debugger will know it's meant to start a debugging loop there.
https://code.kryo.se/iodine/
https://blog.torproject.org/introducing-webtunnel-evading-censorship-by-hiding-in-plain-sight/