this post was submitted on 14 Sep 2024
55 points (96.6% liked)

Selfhosted

39238 readers
307 users here now

A place to share alternatives to popular online services that can be self-hosted without giving up privacy or locking you into a service you don't control.

Rules:

  1. Be civil: we're here to support and learn from one another. Insults won't be tolerated. Flame wars are frowned upon.

  2. No spam posting.

  3. Posts have to be centered around self-hosting. There are other communities for discussing hardware or home computing. If it's not obvious why your post topic revolves around selfhosting, please include details to make it clear.

  4. Don't duplicate the full text of your blog or github here. Just post the link for folks to click.

  5. Submission headline should match the article title (don’t cherry-pick information from the title to fit your agenda).

  6. No trolling.

Resources:

Any issues on the community? Report it using the report flag.

Questions? DM the mods!

founded 1 year ago
MODERATORS
 

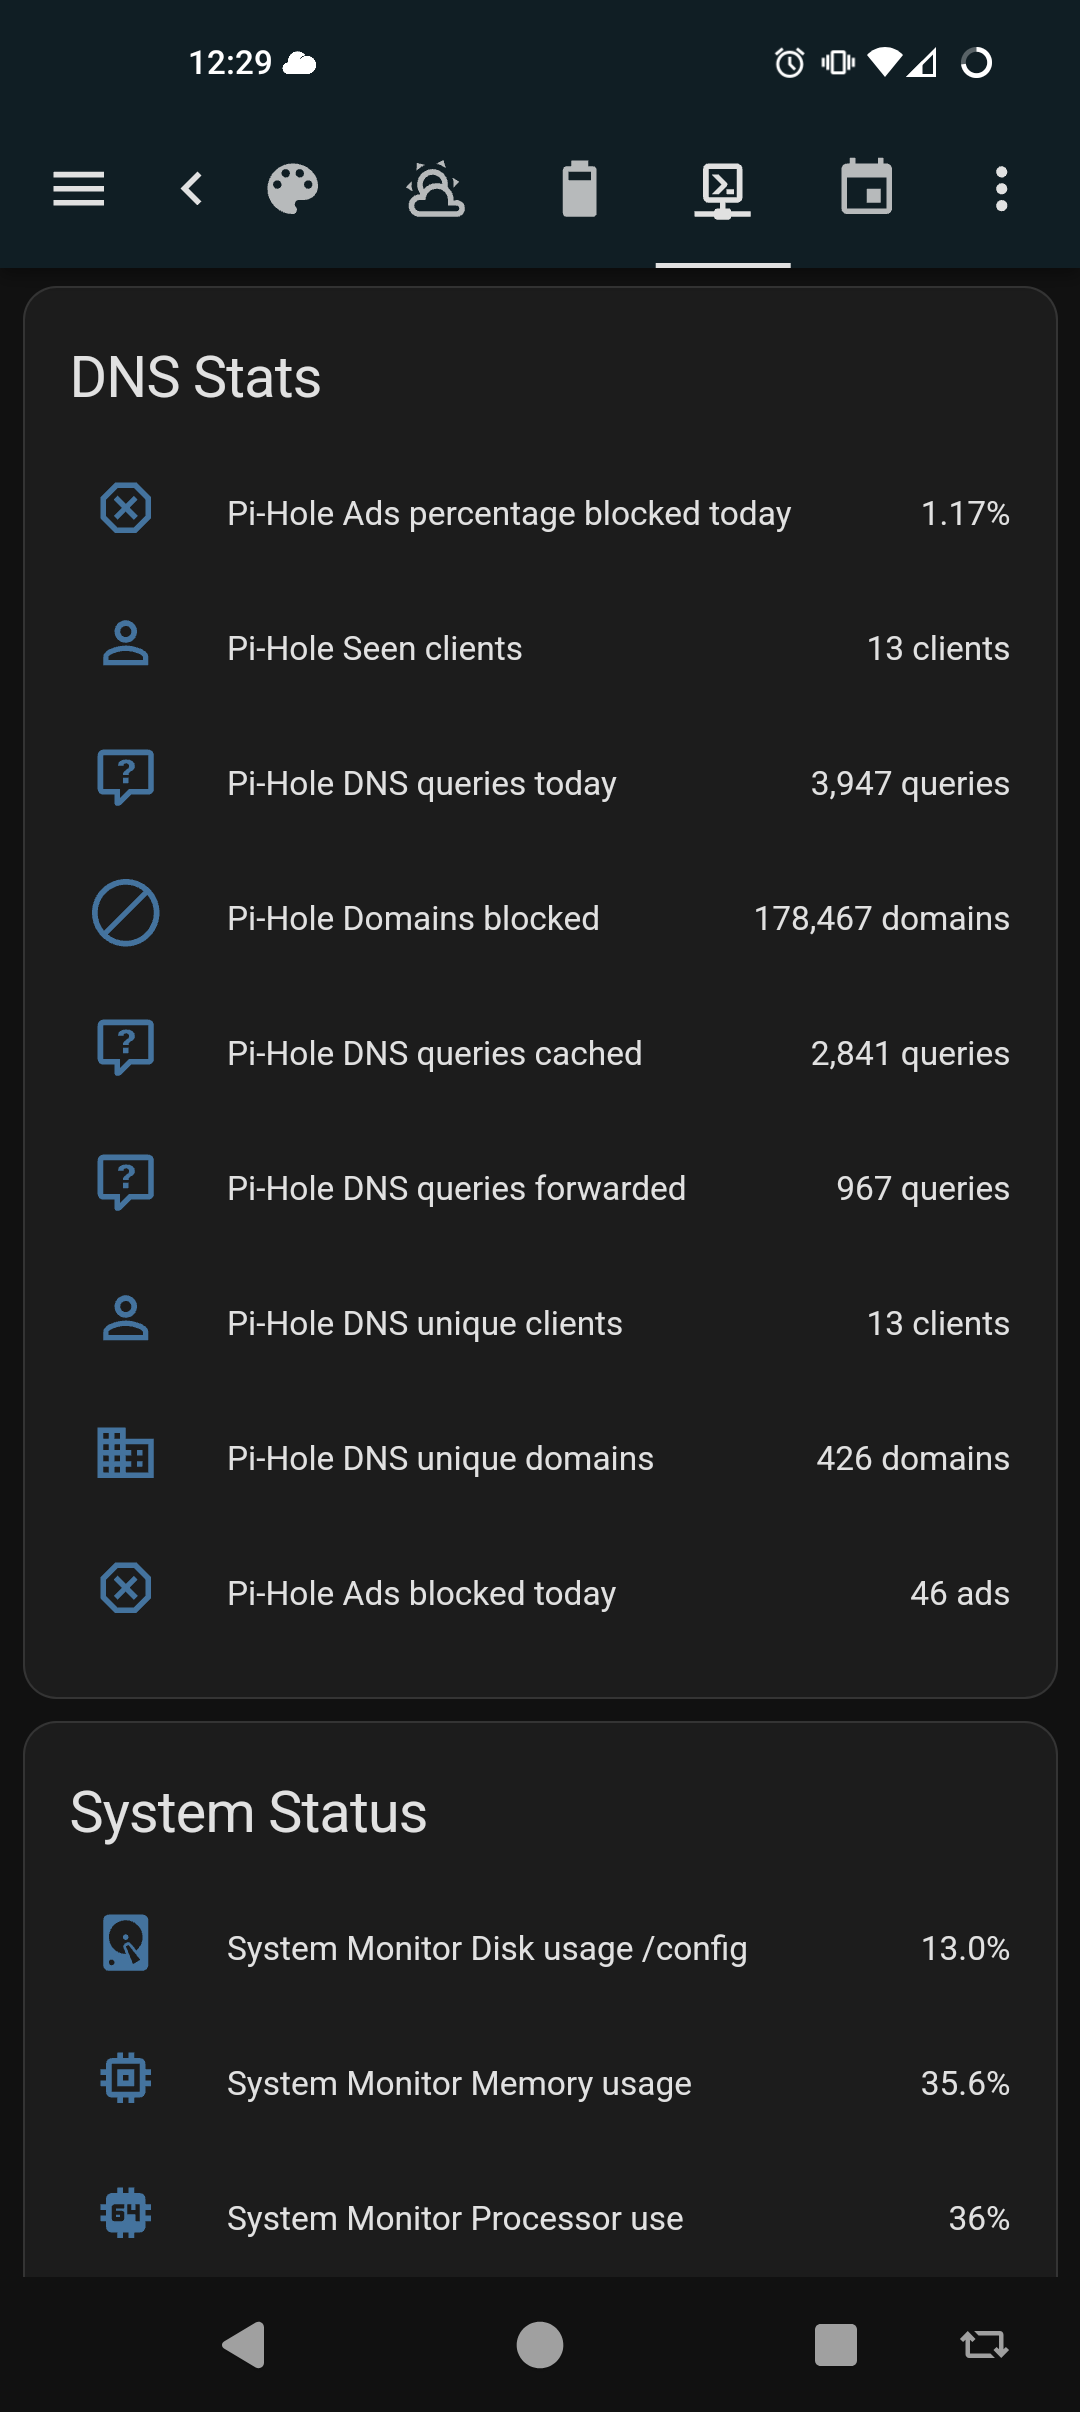
Hi there, I've just done the switch from NextDNS to PiHole. Simply because I want to test it out + self-host my DNS. I set up PiHole+Unbound two days ago, and yesterday the amount of "Queries blocked" was much higher that it is now. But this morning the number was down back to 100ish. Is this normal behaviour, is it supposed to reset the counter? I'd rather it didn't. Let me know if this is my fault or a setting I've managed to miss.

Thank you.

top 23 comments
sorted by: hot top controversial new old
[–] [email protected] 35 points 4 days ago (1 children)

That counter, I believe, for the last 24 hours. It will fluctuate up and down across your active daily periods

[–] [email protected] 6 points 4 days ago (1 children)

Oh okay good to know, is there a way to change this though? Would be "cooler" to see the total amount imo.

[–] [email protected] 14 points 4 days ago (1 children)

So, like a running sum? No, I don't think so, not in Pi-hole at least.

Pi-hole does have an API you could scrape, though. A Prometheus stack could track it and present a dashboard that shows the summation you want. There are other stats you could pull as well. This is a quick sample of what my home assistant integration sees

[–] [email protected] 18 points 4 days ago (1 children)

Make sure you're also blocking all other outbound DNS at your firewall. Many "smart" devices (and presumably some apps, though I have no way to check this) are hard coded to use 8.8.8.8 regardless of what DCHP says to use.

[–] [email protected] -3 points 4 days ago (1 children)

Install Pi-Hole to block ads but use DNS server provided by the biggest ad company? o.O

[–] [email protected] 12 points 4 days ago

No he is saying that many smart devices ignore your DNS (pi-hole) as they hardcoded their DNS address to 8.8.8.8. So it is important to have an additional layer to block at the firewall.

[–] [email protected] 6 points 3 days ago* (last edited 3 days ago) (1 children)

Although not exactly what you are looking for (ie custom counters on the landing page), you can view counters you are after on another page under 'Long-term Data > Query Log'

[–] [email protected] 6 points 3 days ago

Thanks this is good too!

[–] [email protected] 4 points 4 days ago (1 children)
[–] [email protected] 13 points 4 days ago (2 children)
#### MAXLOGAGE=24.0
Up to how many hours of queries should be imported from the database and logs? Values greater than the hard-coded maximum of 24h need a locally compiled `FTL` with a changed compile-time value.

I assume this is the setting you are suggesting can extend the query count period. It still will only give you the last N hours' worth of queries, which is not what OP asked. I gather OP wants to see the cumulative total of blocked queries over all time, and I doubt the FTL database tracks the data in a usable way to arrive at that number.

[–] [email protected] 4 points 4 days ago (2 children)
[–] [email protected] 2 points 3 days ago (1 children)

If it helps, Adguard Home has individual settings of 24h, 7d, 30d, 90d for logs and stats.

[–] [email protected] 1 points 3 days ago

I will try that one next to see how it compares. Thanks for letting me know 👍

[–] [email protected] 3 points 4 days ago (1 children)

No worries, the other poster was just wasn't being helpful. And/or doesn't understand statistics & databases, but I don't care to speculate on that or to waste more of my time on them.

The setting above maxes out at 24h in stock builds, but can be extended beyond that if you are willing to recompile the FTL database with different parameters to allow for a deeper look back window for your query log. Even at that point, a second database setting farther down that page sets the max age of all query logs to 1y, so at best you'd get a running tally of up to a year. This would probably at the expense of performance for dashboard page loads since the number is probably computed at page load. The live DB call is intended for relatively short windows vs database lifetime.

If you want an all-time count, you'll have to track it off box because FTL doesn't provide an all-time metric, or deep enough data persistence. I was just offering up a methodology that could be an interesting and beneficial project for others with similar needs.

Hey, this was fun. See you around.

[–] [email protected] 2 points 3 days ago

Appreciate the explanation, have a good one 👊